
Several sites including worldometer, CDC, and others report “Headline Totals” data which is misleading and non-informative for general public decision making.
First, establishing a baseline, the 2017-2018 flu season had an estimated 61,099 fatalities with 3,446 of those under 50 years old.
As of 9/9/2020, the CDC reports a total of 175,866 COVID deaths in the US.
But looking deeper beyond the surface reporting, it can be found that:
The total deaths for the population under 50 years old is 8877 (5.0% of COVID total and about 2.6 times that of 2018 flu season)
The total deaths for the population over 84 years old is 54,838 (31.2% of total)
The total deaths for the population over 74 years old is 101,325 (57.6% of total)
The US life expectancy for those 75 years old in 2017 was to live until 87 years old
And it is important to realize that most of the deaths attributed to COVID are related to non-COVID health concerns.
COVID looks to be about 3 times worse than the 2017-2018 flu season. But that may be exaggerated because COVID fatalities have been exaggerated. It appears that the exercise of halting the economy, limiting freedom to enjoy healthy outdoor areas, and intensely watching media coverage of COVID deaths multiple times per day has significantly been a morbid fascination in observing people beyond average life expectancy pass-on. About 30% of the deaths attributed to COVID were of those who were about to leave us even without COVID. Most of the economic challenges and resulting secondary effects could have been averted using good Safety Protocols while keeping the economy largely intact. Sadly, even with complete “lockdowns”, many deaths were not preventable. A better plan would have lowered severe cases and death counts and had almost no negative impact to the economy. In short, providing education, using safety protocols, increasing indoors ventilation, and wearing masks indoors could have averted major economic impact and protected the vulnerable..
In most local reporting, any breakdown of deaths and cases does not present commentary that includes co-morbidity information, general health status prior to COVID, and case severity data that is critical to make the data useful for personal decisions and public policy.
The following sections document additional ways in which COVID data is presented inaccurately or in a manner that results in misinformed perspectives.
Total Cases
The name Total Cases is misleading. It leads one to believe that this is the number of Total Infections. It is not. It is the Total REPORTED Cases CONFIRMED BY A PCR VIRAL PRESENCE NASAL / THROAT MUCOSAL SWAB TEST POSITIVE RESULT. It is not the real number of Total Infections.
Not everyone with symptoms is tested, especially true before mid-late April when test availability increased significantly. Even now, there are people without access or people who do not want to be tested who avoid testing and treat their case of COVID-19 like they do any other sickness.
16 to 27 Million
On June 25, 2020, CDC director Robert Redfield reported that somewhere on the order of 16 to 27 million of the US population has been infected (5% to 8%). The vast majority of these infections are not currently active – they were people who recovered weeks and months ago.
“But all in all, I think you’re in the right range, that somewhere between 5%, 6%, 7%, 8% of the American public has experienced infection, whether they recognized it or not. The estimate that we have given you at this point is it appears that the rate is — and this is CDC’s serology data — that the rate is approximately ten seropositive antibody individuals for every one case. Obviously, that will be refined in the weeks ahead, but I think, you’re right, looks like somewhere between 5% and 8% of the American public.” – Robert Redfield, Director of the Centers for Disease Control and Prevention
Antibody serology testing demonstrates that, as of late April, there were on the order of 10 to 50 times more Total Cases in reality than the daily reporting data shows. Most people do not know this, yet they look at Total Cases almost daily and many media sources quote it matter-of-factly without any reference to the “hidden cases” which far outnumber the reported cases. Given the data from these antibody serology studies, it is possible that even more people have become infected and recovered than the CDC’s June 2020 estimate.
Additionally, any changes in the REPORTED Total Cases over time likely reflect a change in testing availability and usage over time more than they reflect a genuine change in the true number of cases.
An error in data collection where PCR viral presence and antibody serology test data is combined rather than analyzed separately has an unknown impact. Yet another error in the CDC data science.

Total Recovered
The same is true for Total Recovered. There are many people that
- had symptoms and didn’t get tested because tests were not yet highly available
- didn’t understand what they had was COVID19 because before March 2020, they didn’t even know COVID-19 existed in the US.
- felt nothing significant but had it
- had symptoms and never reported it for various reasons
As of late June 2020, it is estimated that between 12 to 25 million people in the US have recovered, have measurable antibodies and those antibodies are likely to afford some level of future immunity, knowing that those antibodies were responsible for resolving the initial infection.
This Total Recovered estimate is based on subtracting the Reported Active Cases from the CDC estimate of Total Infections as of late June 2020 with some error bounding adjustments that reduce lower bound number to improve confidence of the range.
Total Deaths
Based on demographic research of the New York area, about 30% of the reported Total Deaths were on hospice or otherwise in skilled-nursing facilities with general systemic failure / old age related co-morbidities and requiring daily nurse care prior to COVID-19 infection. It would probably be most informative to the general public and even older citizens in generally self-maintaining health condition to separate those skilled-nursing care deaths into a separate category. A ReallyCorrect editor made requests to the CDC, worldometer, and other reporting agencies to categorize in that manner. The best response to that request was a mostly unrelated form-letter.
Additionally a statistically significant number of Total Deaths were caused by improper medical care, particularly in New York (yet keeping in mind that other factors such as high density and indoor settings were also significant contributors to the New York morbidity).
Also problematic is the fact that even deaths from a car accident could be listed as a COVID-19 death if the person was found to be COVID-19 positive via a PCR viral presence test.
“Although the decedents did test positive for COVID, that is not what they died from. The two cases were autopsied, and the cause of death was listed as ‘blunt force Injuries due to a gunshot wound.’”
“It might be the process, but it’s not right,” responded Bock, “and I strongly stand against that. I have been talking to other Coroners throughout the state and they have been telling me that they’ve had motor vehicle accidents listed as COVID deaths. It’s no different than my gunshot wounds being listed as COVID deaths, and it’s not right.”
Alameda County, CA was still using this errant counting method over a year later, in May 2021.


And that might be too low. But there’s no way to know because of the horrible guidelines and rules for reporting.


Mortality Rate
Because Mortality Rates are calculated from the above, many reported mortality rates are also incorrect; although, most sources are no longer reporting mortality rates.
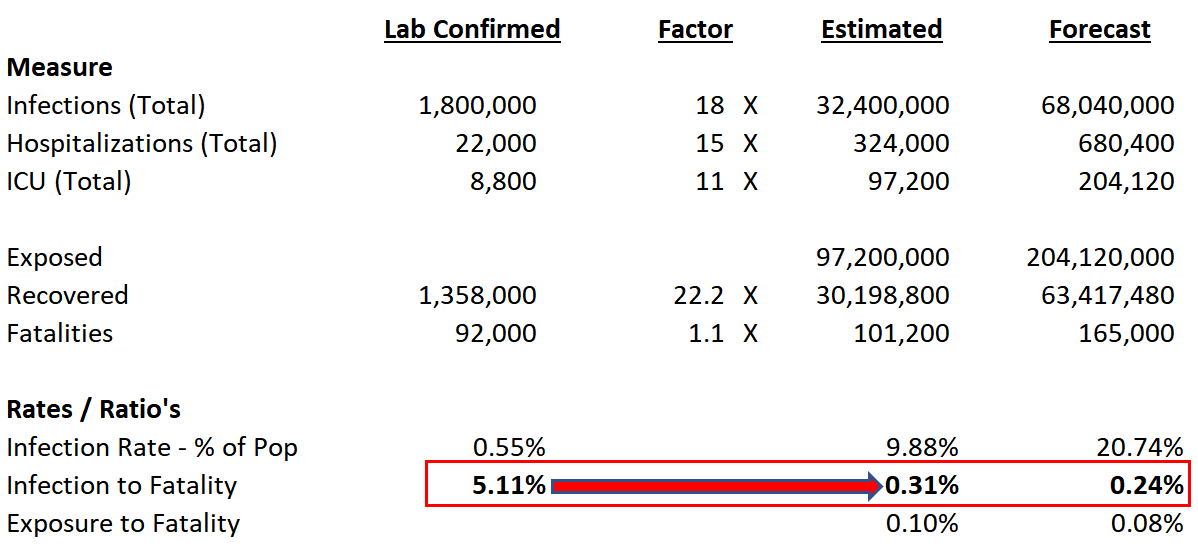
Antibody test data appears to show mortality rates of COVID-19 are on the order of 0.3% which can be compared with Dr. Fauci’s quote of 0.1% for seasonal flu. This is far lower than some early COVID-19 mortality estimates of 3%.
“America’s worst flu season in recent years was in 2017-2018 when more than 61,000 people died, according to the U.S. Centers for Disease Control.
… The only deadlier flu seasons were in 1967 when about 100,000 Americans died, 1957 when 116,000 died and the Spanish flu of 1918 when 675,000 died, according to the CDC.”


Regarding seasonal flu, it is apparent the CDC concluded that:
“It has been recognized for many years that influenza is underreported on death certificates and patients aren’t always tested for seasonal influenza infection, particularly the elderly who are at greatest risk of seasonal influenza complications and death.”
so apparently the CDC changed how seasonal flu is counted to the current method of
“Seasonal influenza-related deaths are deaths that occur in people for whom influenza infection was likely a contributor to the cause of death, but not necessarily the primary cause of death.”
This excessive attribution of flu death would tend to make old age / general systemic failure appear as flu death. Often a flu overpowers the generally weak / failing system of someone who is very close to leaving us for reasons of old age / general systemic failure and it’s now counted as a flu death. And even more so with COVID per the Illinois CV Task Force noted in the video above where “even if you died of a clear alternate cause and you had COVID it is still listed as a COVID death“.
It almost seems like the CDC wants to increase statistics of flu deaths and COVID deaths. What reason would the CDC have for doing this? Could this be the underlying reason Dr. Birx has expressed frustration with the CDC methodologies?
“Why is it difficult to know exactly how many people die from flu?” – Read on…


Fear, Uncertainty, And Doubt
Popular media, generating revenue through advertising impressions and clicks, often attempts to maximize the likelihood of a story creating a “click” so that it may generate additional advertising impressions, clicks, and conversions. Playing on Fear, Uncertainty, and Doubt can be a powerful revenue generation tool. Misleading and sensational “click bait” headlines are often constructed to generate more clicks than those of a less provocative nature. For example, a headline stating “How worrying are reports the first person in the world has been re-infected with coronavirus?” is more likely to be clicked than “Scientifically documented case of someone appearing to exhibit immunity after 4.5 months” even though both characterize the same scientific study.
Additionally, popular media and governments often present data as part of an attempt to exert control rather than educate. Various people believe different parts of the [mis]information and sometimes begin unhealthy encounters. Misinformation creates cognitive dissonance that results in behavior conditioned by Forced Compliance Techniques. Many people who are highly intelligent and mentally strong are less affected, but misinformation has effects on everyone.
Also see Safety Information
Also see Antibody Testing
Los Angeles County Data Reporting Error
Here is an example of worldometer.com presenting incorrect data.
Look at https://www.worldometers.info/coronavirus/usa/california/
As of 7/6/2020 it showed:
| County | Total Cases | New Cases | Total Deaths | New Deaths | Active Cases | Total Tests | Source |
|---|---|---|---|---|---|---|---|
| California Total | 277,433 | 6,445 | 197,659 | 4,793,353 | |||
| Los Angeles | 116,570 | 3,534 | 113,036 | 1,179,291 | [county] [state] |
Doing some basic math, we have the formula:
TotalCases = TotalDeaths + ActiveCases + RecoveredCases
Make sense?
So, if we apply the numbers in the Los Angeles row we get:
116,570 = 3534 + 113036 + 0
So, according to worldometer.com, ZERO people in Los Angeles county have recovered. According to the worldometer, everyone that was ever infected is either currently actively infected or dead. Do you believe that or do you think it is an error?
In fact, there is not even a COLUMN for recovered. Apparently, recovery is not important.
UPDATE: 7/3/2020
Finally, the CDC admits that the total cases are 6 to 24 times higher than reported case counts based upon data from several antibody studies. But many studies show this number to be between 10 to 50 times higher. This higher Total Infections count means that the fatality rate is far lower than the erroneous daily reporting would suggest. It also means that as of July 2020, low 10’s of millions in the US have become infected, recovered, have measurable antibodies and those antibodies are likely to afford some level of future immunity, knowing that those antibodies were responsible for resolving the initial infection.
The Total Deaths are still poorly categorized and do not provide running totals data that helps assess risks. The COVID19 running death totals would be much more informative if broken down as follows because people could clearly identify their risk level and take appropriate precautions:
- Hospice-status (declared hospice or not)
- SNF-status (in a Skilled Nursing Facility or not)
- Obesity status (separated into, say 4, Body Mass Index ranges)
- Hypertension status (Blood Pressure ranges + using or not using therapeutic drugs)
- Various diabetes types status
- Various asthma types status
- Other risk-factors.
The Provisional Death Count Data needs to be broken down by pre-existing health condition, not just age and race. An 80 year old taking walks and minding their own daily functions is not the same as an 80 year old on hospice in diapers and hourly nurse care in a SNF. Race data is not informative unless the demographic data for the reporting areas are factored into the numbers. This data must be collected and presented in an actionable manner. People with asthma or other risk factors currently have no solid running totals data to help identify what their risk is relative to someone without asthma. Even many months in, the “big picture” summary reporting is still some of the worst data science on the planet. It frightens many with low-risk of severity and does not help clearly identify the various risk levels for higher-risk people by type of pre-existing health condition on a running totals basis; which would help anyone with 5th grade math skills translate into actions and behavior. With those criticisms, after several months, the CDC is beginning to show some signs of integrity, transparency, and competence.
UPDATE: 8/30/2020
“The Centers for Disease Control released information showing how many people who died from COVID-19 had comorbidities or underlying conditions as they are sometimes referred to by doctors.”. This can be found here.